Research and publish the best content.
Get Started for FREE
Sign up with Facebook Sign up with X
I don't have a Facebook or a X account
Already have an account: Login

Social Marketing Revolution
23.0K views |
+0 today


 Your new post is loading...
 Your new post is loading...
Your new post is loading...
|
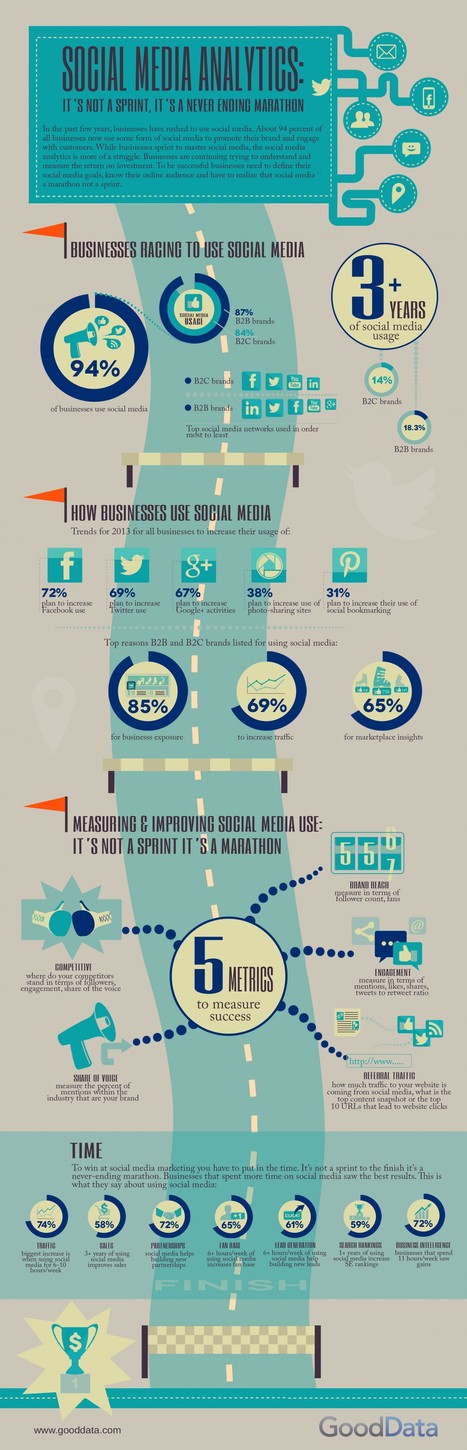
In the past few years, businesses have rushed to use social media. About 94 percent of all businesses now use some form of social media to promote their brand and engage with customers. To be successful businesses need to define their social media goals, know their online audience and have to realize that social media is a marathon not a sprint. Via Lauren Moss, Vincent Bastide, sophiedesc
Martin (Marty) Smith's insight:
Interesting infographic confirming a trend we see in content marketing too. B2C accounts are slight laggards to their B2B cousins on social media usage and pickup. I have three secret theories about social media: 

Kwang Hyun's curator insight,
December 4, 2013 8:07 PM
This is just a data analysis how we use the social media. What we use, how we use it, when we use it, etc.
Kwang Hyun's curator insight,
December 13, 2013 1:25 AM
Just a simple infographic about the social media analysis. How we use it and what do we use it. It is very important which tool is the best to use and who uses it the most. That's how we get general information all over the world. 
Dr Pam Hill's curator insight,
January 8, 2014 8:41 AM
Great insights into the growth of social media in business with hints of how education could strengthen their programs to further engage parents, students, and the community at large. |


When a 1 in a million thing happens 500 times a day, there are not 500,000,000 tweets a day, you have to think in scale as Del Harvey explains in her excellent TED Talk. Community demands a proactive stance or, as Harvey explains, having someone think about and prevent catastrophe.
"I pause and think, how could all of this go horribly wrong?" The idea of visualizing catastrophe is a must when one in a million happens 500 times a day.
Great example of how a community manager must think "in scale" and create "smart protections" that help without hindering.